Fleet Pricing Signals: A Leading Indicator for Cruise Yield
Fleet Pricing Signals detect coordinated pricing movements across an operator's fleet. When 15% of Royal Caribbean's sailings drop 10%+ in a week, that's not noise—it's a signal worth investigating.
What Are Fleet Pricing Signals?
Fleet Pricing Signals measure the percentage of an operator's tracked sailings with significant price movement (10%+) within a selected time window.
We track two signal types:
| Signal | Trigger | What It Indicates |
|---|---|---|
| Drop Signal | >10% of fleet drops 10%+ | Broad promotional activity or inventory pressure |
| Rise Signal | >10% of fleet rises 10%+ | Demand strength or yield optimization |
These signals surface fleet-wide pricing behavior rather than isolated sailing adjustments.
Why 10%?
We set the threshold at 10% based on observed cruise pricing patterns:
- <5% movement: Normal yield management noise—operators adjust constantly
- 5-10% movement: Meaningful but common, especially close to departure
- >10% movement: Significant repricing that warrants attention
A 10% price drop on a $200 PPPN sailing means $140+ less revenue per cabin over a 7-night cruise. At fleet scale, this represents material yield impact.
How Signals Are Calculated
Step 1: Track Price Changes
For each sailing, we compare current price to price at the start of the selected window (7 days, 30 days, or QTD).
Step 2: Flag Significant Movement
Sailings with >10% decrease are flagged as "drops." Sailings with >10% increase are flagged as "rises."
Step 3: Calculate Fleet Percentage
Drop % = Sailings with 10%+ drop ÷ Total tracked sailings × 100
Rise % = Sailings with 10%+ rise ÷ Total tracked sailings × 100
Step 4: Trigger Signals
If either percentage exceeds 10%, we trigger the corresponding signal.
Reading the Signals
Single Signal (Drop OR Rise)
Drop signal only: Operator is discounting broadly. Could indicate:
- Inventory pressure on near-term sailings
- Promotional campaign to drive wave season bookings
- Competitive response to rival pricing
Rise signal only: Operator is raising prices broadly. Could indicate:
- Strong demand allowing yield optimization
- Pulling back from promotional period
- Capacity constraints on popular itineraries
Both Signals Triggered
Bidirectional movement—both drop and rise signals active—suggests active inventory rebalancing:
- Discounting near-term sailings that aren't filling
- Raising prices on peak-season departures with strong demand
- Different strategies by brand within a ticker (e.g., Royal Caribbean vs. Celebrity)
This is common during booking transitions (wave season start, seasonal shifts).
No Signals
Less than 10% of fleet moving 10%+ in either direction. Pricing is stable—operators are holding rates without major promotional activity.
Investment Applications
Leading Indicator for Yield
Fleet signals often precede earnings commentary by weeks or months. When CCL triggers a drop signal in October, that promotional activity will impact Q4 yield metrics reported in January.
Comparing Operator Discipline
Side-by-side signal comparison reveals which operators are holding price versus chasing volume:
| Operator | Sailings | Drop % | Rise % | 30d Net | Interpretation |
|---|---|---|---|---|---|
| CCL | 5,297 | 25.9% | 12.5% | -2.1% | Both signals triggered, net negative |
| RCL | 5,089 | 16.5% | 24.3% | +3.9% | Both signals triggered, net positive |
| NCLH | 1,758 | 10.7% | 6.8% | +0.3% | Drop signal only, rise below threshold |
Spotting Strategy Shifts
A sudden change in signal patterns—an operator that held discipline for months suddenly triggering drop signals—warrants investigation. Did demand soften? New competitive pressure? Strategic pivot to volume?
Time Windows
| Window | Best For |
|---|---|
| 7 days | Detecting fresh promotional activity or demand response |
| 30 days | Smoothing weekly noise, tracking monthly patterns |
| QTD | Aligning with earnings periods, quarter-over-quarter comparison |
Shorter windows catch signals faster but include more noise. Longer windows provide cleaner trends but lag real-time activity.
What Signals Don't Tell You
Fleet Pricing Signals indicate that pricing is moving, not why. Possible drivers include:
- Demand changes (up or down)
- Competitive dynamics
- Deliberate promotional strategy
- Inventory management close to departure
- New ship launches or itinerary changes
Signals are a starting point for analysis, not a conclusion. Cross-reference with booking curve data, promotional discipline trends, and management commentary for context.
Example: Reading the Dashboard
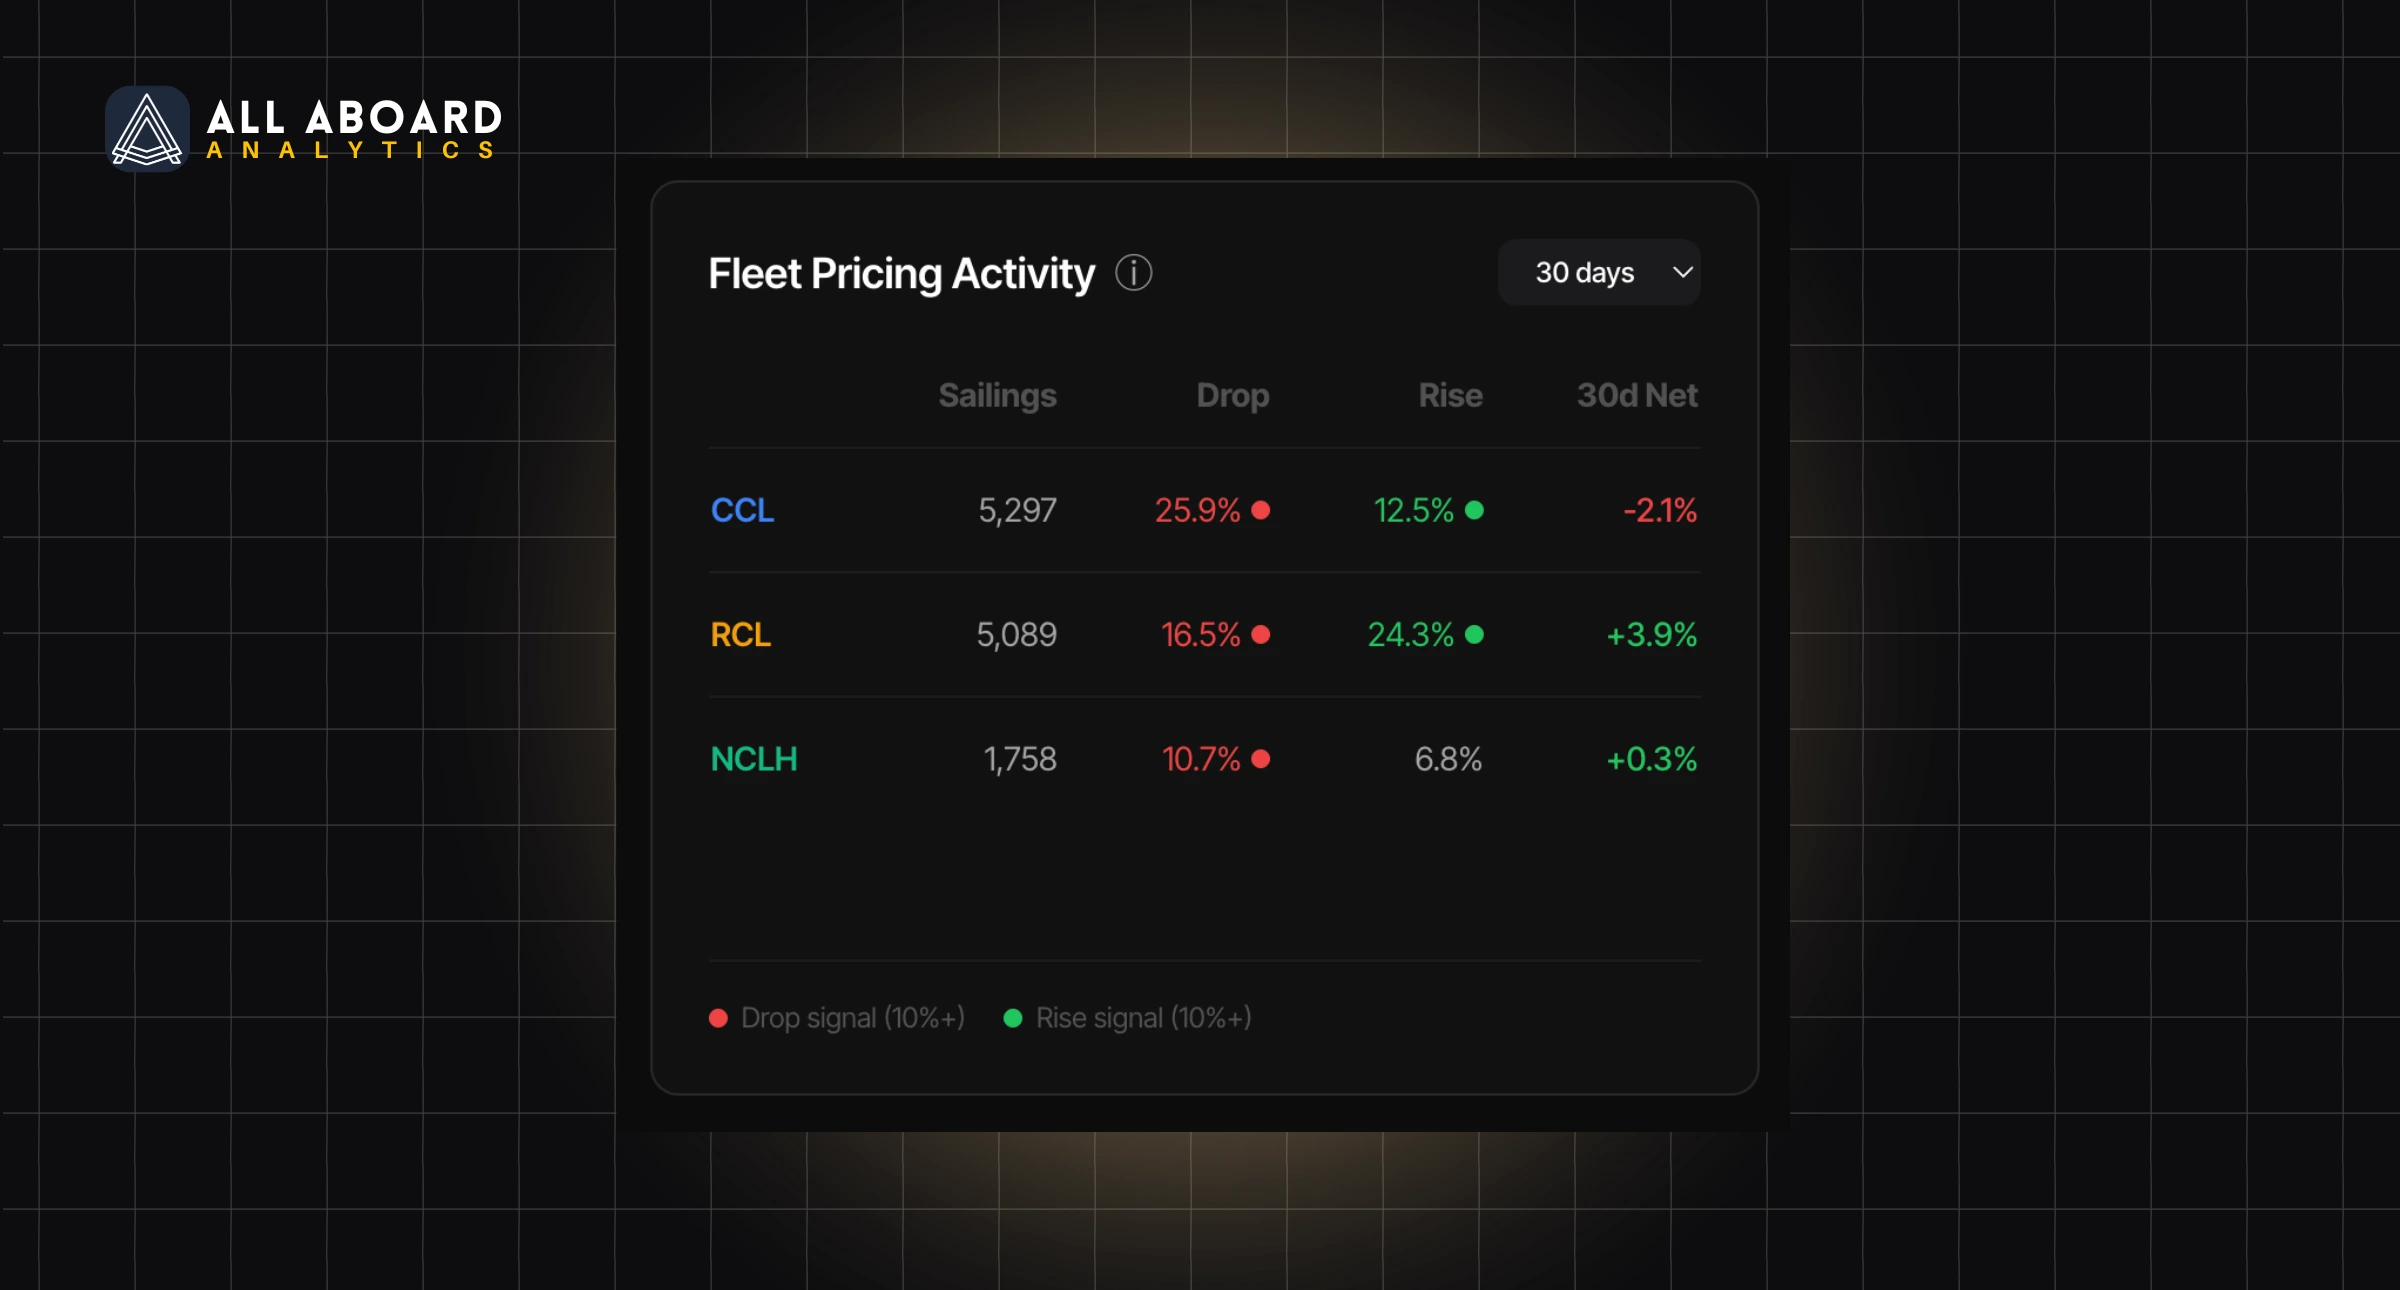
Looking at the Fleet Pricing Activity panel above:
RCL shows 16.5% drops and 24.3% rises over 30 days, with a +3.9% net change. Both signals are triggered (bidirectional movement), but rises outpace drops—suggesting strong demand allowing price increases on more sailings than are being discounted.
CCL shows 25.9% drops and 12.5% rises, with a -2.1% net change. Both signals triggered, but drops dominate—indicating broader promotional activity or inventory pressure across the fleet.
NCLH shows 10.7% drops and 6.8% rises, with +0.3% net change. Only the drop signal is triggered (rises are below the 10% threshold). The small net positive suggests targeted discounting without broad price erosion.
This side-by-side view reveals divergent strategies: RCL is optimizing yield while CCL appears to be chasing volume.
Related Metrics
- Regional Pricing Signals — Geographic breakdown of fleet signals
- Understanding PPPN — The normalized pricing metric underlying signals
- Data Methodology — Full methodology documentation
Questions?
For methodology questions: hello@allaboardanalytics.com
Frequently Asked Questions
A signal triggers when more than 10% of an operator's tracked sailings show 10%+ price movement within the selected time window (7 days, 30 days, or QTD).
Found this helpful?
About the Author

Graham Heldreth — Founder & CEO
Graham is the founder of All Aboard Analytics, a cruise pricing intelligence platform serving institutional investors and equity research teams.
With a background in UX and product design, he built All Aboard Analytics to solve a data gap he saw firsthand — cruise pricing is opaque, fragmented, and difficult to track systematically. The platform now monitors millions of price snapshots across 185 ships and 13 cruise lines, segmented into commercial, premium, and luxury tiers.
Graham has spent over 15 years designing digital products and data interfaces. He's also logged 15+ cruises across the major operators, giving him practical insight into how yield management and promotional strategies play out at the booking level.
Editorial Standards
All guides are based on real pricing data, live fare checks, and historical trends. Content is updated as ships launch and prices change. Questions or corrections? Contact us