Regional Pricing Signals: Where Cruise Demand Is Moving

Regional Pricing Signals break down fleet-wide pricing movements by geography. While Fleet Pricing Signals show "RCL is discounting," Regional Pricing Signals show "RCL is discounting in the Caribbean."
What Are Regional Pricing Signals?
Regional Pricing Signals detect significant price movements (10%+) within specific destination markets. They answer: Where is the pricing activity happening?
A fleet-wide drop signal might be driven entirely by Caribbean discounting while Alaska holds firm—or vice versa. Regional signals surface this geographic nuance.
Regions Tracked
| Region | Example Itineraries |
|---|---|
| Caribbean | Eastern, Western, Southern Caribbean |
| Alaska | Inside Passage, Glacier routes |
| Mediterranean | Western Med, Greek Isles, Adriatic |
| Mexican Riviera | Cabo, Puerto Vallarta, Mazatlan |
| Bermuda/Bahamas | Short cruises from East Coast |
| Europe - Northern | Baltic, Norwegian Fjords, British Isles |
| Asia Pacific | Japan, Southeast Asia, Australia |
| Hawaii | Inter-island, Pacific Coast to Hawaii |
| Panama Canal | Full transit, partial transit |
| South America | Brazilian coast, Patagonia |
| Transatlantic | Repositioning cruises |
Region assignment is based on primary itinerary destination, not departure port. A cruise departing Miami to the Bahamas is classified as "Bermuda/Bahamas," not "Caribbean."
Display Thresholds
To filter noise, regional signals must meet both conditions:
| Threshold | Value | Reason |
|---|---|---|
| Absolute sailings | ≥25 | Filters out regions with minimal inventory |
| % of regional sailings | ≥15% | Ensures real pattern, not isolated outliers |
Exception: Extreme movements (>40%) display even if below thresholds—these are significant regardless of sample size.
What Gets Filtered Out
- CCL Mexican Riviera: 10 of 98 sailings (10%) — below 15% threshold
- RCL Transatlantic: 8 sailings affected — below 25 sailing minimum
What Passes
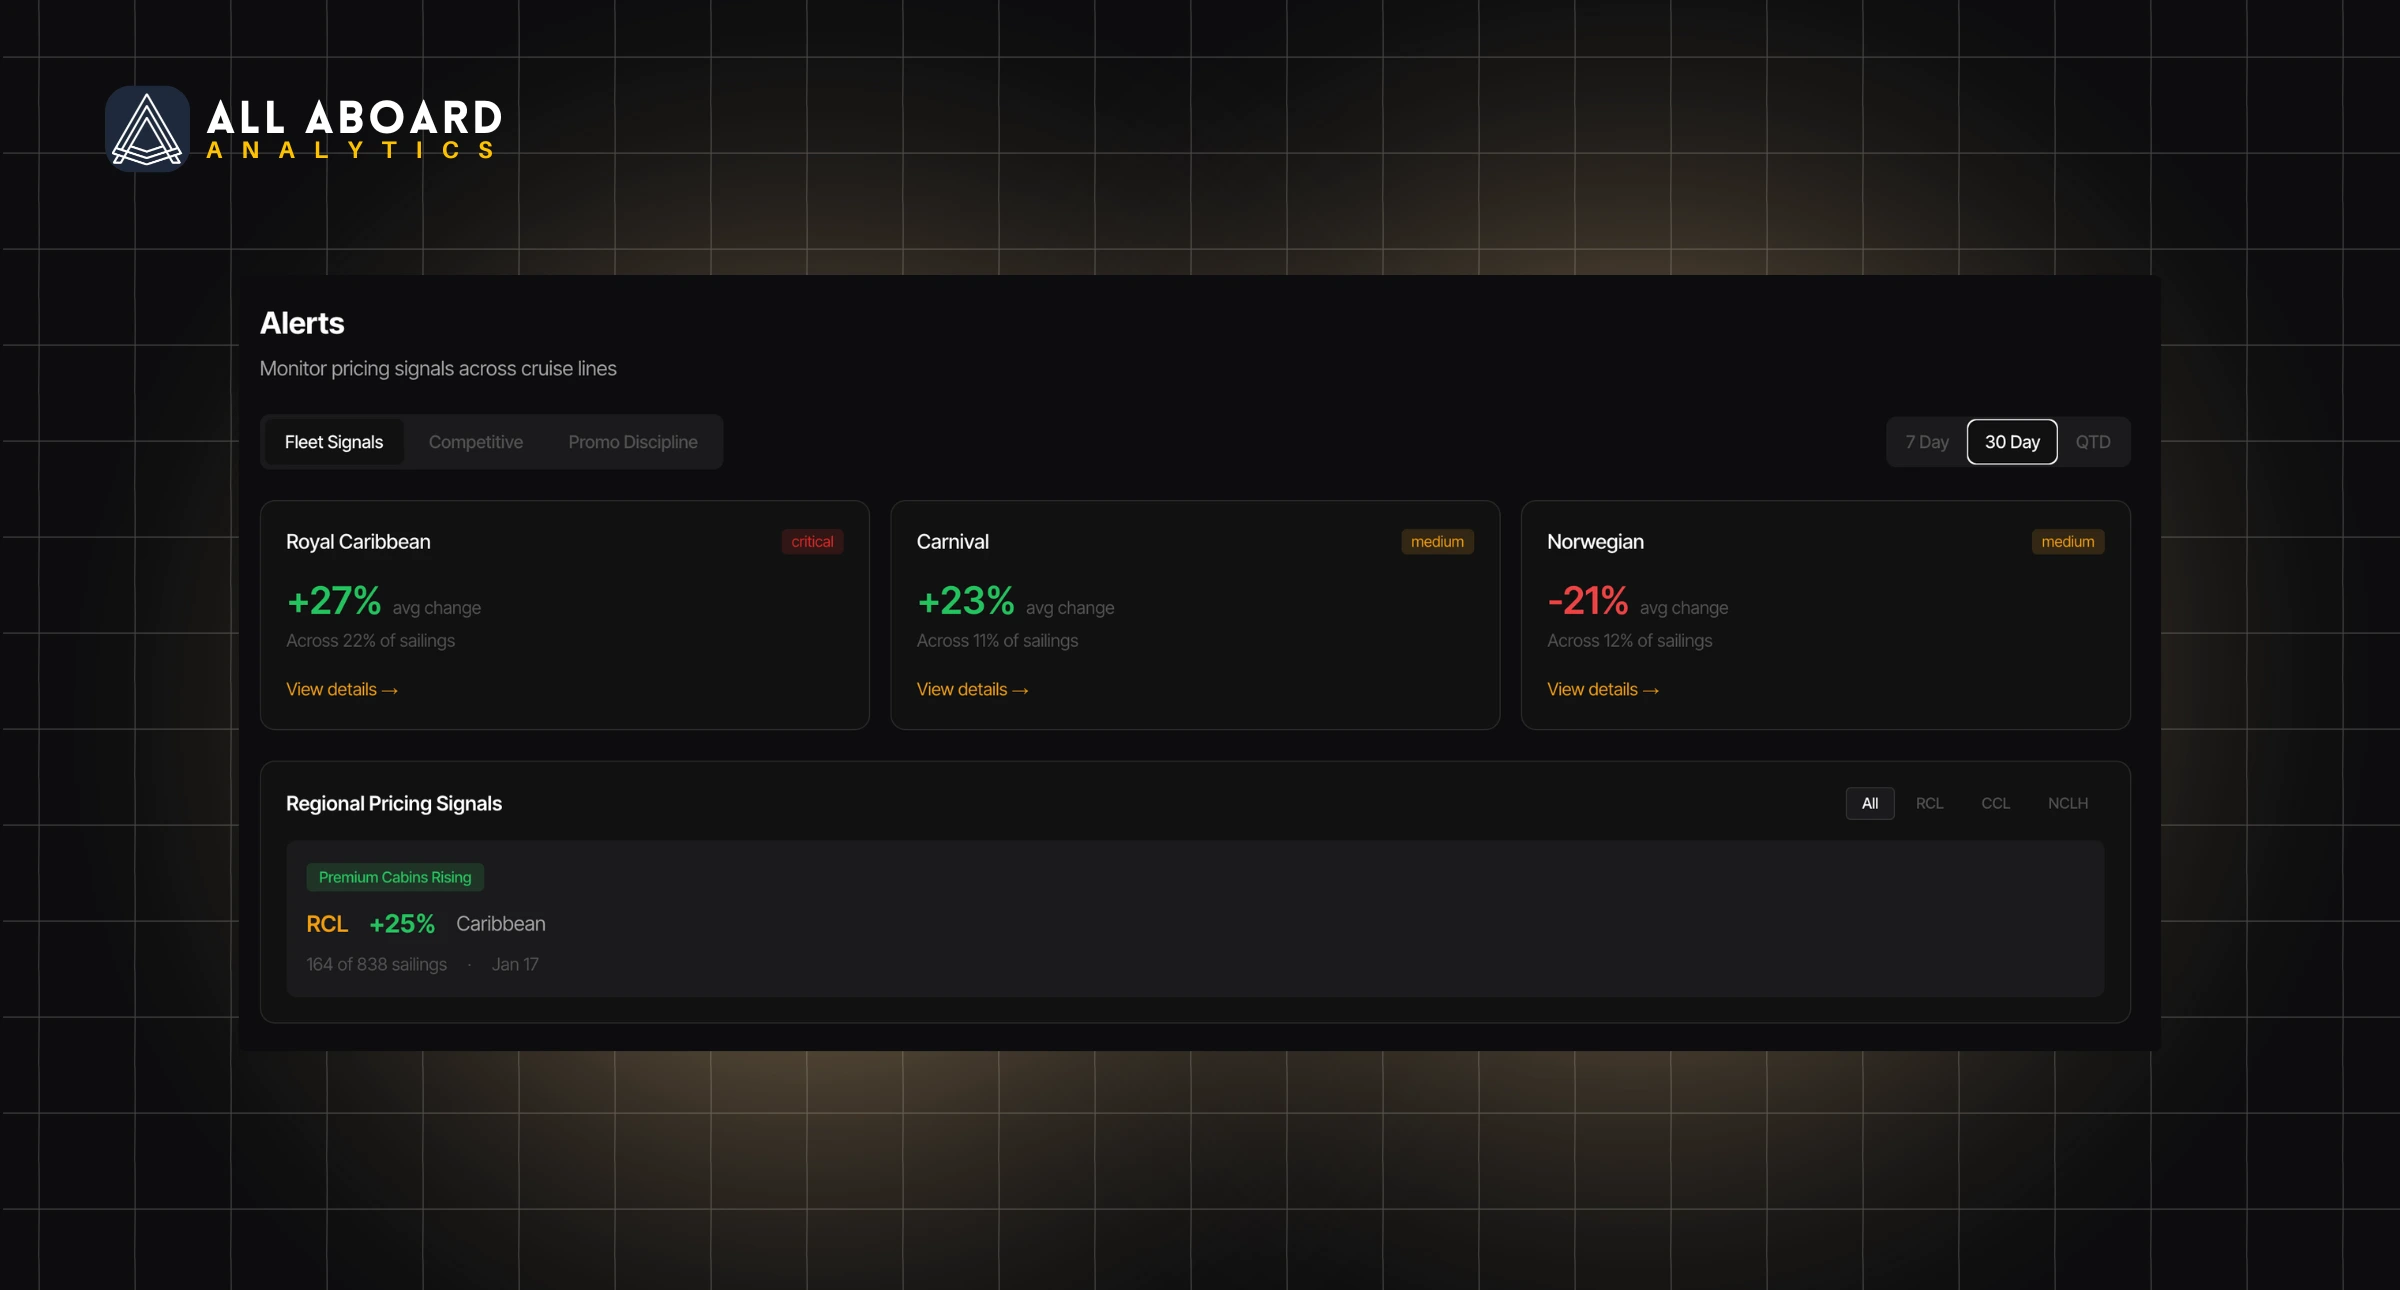
- RCL Caribbean: 164 of 838 sailings (19.5%) — passes both thresholds
What Each Signal Shows
Each regional signal displays:
- Ticker: RCL, CCL, NCLH
- Region: Caribbean, Alaska, etc.
- Avg Change %: Average price change among affected sailings
- Sailings Affected: Count and percentage (e.g., "164 of 838 sailings")
- Detection Date: When the signal was first detected
- Signal Context: Cabin-level breakdown when available
Signal Context (Cabin Breakdown)
Regional signals include cabin-level analysis to show which inventory is moving:
| Context | What's Moving | Interpretation |
|---|---|---|
| Interior Cabins Dropping | Inside cabins | Clearing excess capacity, entry-level demand soft |
| Premium Cabins Dropping | Balcony/Suite | Yield pressure on premium inventory |
| Interior Cabins Rising | Inside cabins | Base demand strengthening |
| Premium Cabins Rising | Balcony/Suite | Premium demand strong, upsell opportunity |
| Broad Decrease | All cabin types | Fleet-wide regional discounting |
| Broad Increase | All cabin types | Broad regional demand strength |
This context helps distinguish between strategies. "Interior Cabins Dropping" in Alaska suggests the operator is filling base inventory before peak season. "Premium Cabins Dropping" would be a different—and potentially more concerning—signal.
Conflicting Signals in the Same Region
You may see both rise and drop signals for the same ticker and region simultaneously. This is not a bug.
Why This Happens
- Different departure windows: Q1 sailings rising while Q2 sailings dropping
- Different itineraries: 7-day cruises rising while 14-day cruises dropping
- Yield management: Raising prices on high-demand dates, discounting low-demand dates
Example
RCL Alaska showing +28% rise and -16% drop on the same day:
- 12 Alaska sailings had ≥10% price increases (avg +28%)
- 10 different Alaska sailings had ≥10% price decreases (avg -16%)
These are different sailings with different departure dates. The operator is simultaneously raising prices on peak-season departures while discounting shoulder-season inventory.
Investment Applications
Regional Demand Signals
Regional signals reveal where demand is soft versus strong before it shows up in earnings.
CCL dropping prices in Alaska but holding firm in Caribbean suggests Alaska-specific demand softness, not fleet-wide weakness. This distinction matters for forecasting.
Competitive Regional Dynamics
Compare operators in the same region:
| Operator | Caribbean Signal | Interpretation |
|---|---|---|
| RCL | +18% rise | Holding/raising prices |
| CCL | -12% drop | Discounting to fill ships |
| NCLH | No signal | Stable pricing |
This suggests RCL is seeing stronger Caribbean demand than CCL—useful context heading into earnings.
Seasonal Pattern Recognition
Track regional signals over time to identify:
- When Alaska discounting typically begins (shoulder season)
- Caribbean pricing strength during wave season
- Mediterranean summer demand patterns
Deviations from historical patterns are often the most actionable signals.
Itinerary Mix Impact
Regional concentration matters for revenue impact:
| Operator | Regional Exposure |
|---|---|
| RCL | ~40% Caribbean |
| CCL | More diversified |
| NCLH | Higher Alaska/Hawaii mix |
A Caribbean-heavy drop signal impacts RCL more than CCL given their exposure. Regional signals combined with fleet mix data enable more precise revenue impact estimates.
Relationship to Fleet Pricing Signals
| Level | Shows | Where |
|---|---|---|
| Fleet Pricing Signals | Ticker-wide aggregate | Dashboard + Alerts |
| Regional Pricing Signals | Geographic breakdown | Alerts page |
Fleet signals are the sum of regional activity. When a fleet-wide drop signal triggers, regional signals show which destinations are driving it.
Think of it as: Fleet signals tell you that something is happening. Regional signals tell you where.
Time Windows
| Window | Best For |
|---|---|
| 7 days | Detecting fresh promotional activity or demand response |
| 30 days | Smoothing weekly noise, tracking monthly patterns |
| QTD | Aligning with earnings periods, quarter-over-quarter comparison |
Shorter windows catch signals faster but include more noise. Longer windows provide cleaner trends but lag real-time activity.
Data Freshness
| Process | Frequency |
|---|---|
| Price data collection | 4x daily |
| Signal detection | Daily (after price collection) |
| Signal display | Real-time query |
Signals reflect price changes as of the most recent daily detection run.
Empty States
When no regional signals appear, either:
- No significant regional pricing movements detected, or
- All movements are below display thresholds
This is intentional—we show only actionable, meaningful patterns rather than noise.
Related Metrics
- Fleet Pricing Signals — Ticker-level aggregate signals
- Understanding PPPN — The normalized pricing metric underlying signals
- Data Methodology — Full methodology documentation
Questions?
For methodology questions: hello@allaboardanalytics.com
Frequently Asked Questions
Regional Pricing Signals detect significant price movements (10%+) within specific destination markets like Caribbean, Alaska, or Mediterranean. They show where pricing activity is happening geographically.
Found this helpful?
About the Author

Graham Heldreth — Founder & CEO
Graham is the founder of All Aboard Analytics, a cruise pricing intelligence platform serving institutional investors and equity research teams.
With a background in UX and product design, he built All Aboard Analytics to solve a data gap he saw firsthand — cruise pricing is opaque, fragmented, and difficult to track systematically. The platform now monitors millions of price snapshots across 185 ships and 13 cruise lines, segmented into commercial, premium, and luxury tiers.
Graham has spent over 15 years designing digital products and data interfaces. He's also logged 15+ cruises across the major operators, giving him practical insight into how yield management and promotional strategies play out at the booking level.
Editorial Standards
All guides are based on real pricing data, live fare checks, and historical trends. Content is updated as ships launch and prices change. Questions or corrections? Contact us